Table of Contents
Overview
Every week I bulk cook all of my meals so I tend to order the same things… a lot. If the grocery store wasn’t so close to me, I would definately be an avid user of Instacart. Once I found their dataset for their Kaggle competition I figured it would be a perfect challenge for me. In case you have not heard of it, Instacart is a grocery delivery app. When you order from the app, someone will pick up your food from the grocery store and deliver it to you. The delivery persons credit card will be filled with just enough money to cover your groceries.
With all of these orders comes a lot of transactional data. In the Kaggle competition, Instacart wants to use this data to predict which previously ordered product will be in a user’s next order. The competition link can be found here
Exploratory Data Analysis
This is one of the largest data sets that I have been able to use so far. It contained transactional information for over 3 million orders made up of 5 thousand products. Eventually I had to use an AWS to engineer features and model. This dataset is a relational database made up of six tables.
- Orders: The orders table has one order per row. The orders are split into past orders labeled as “prior” and the most recent orderes labeled as “train”. Each order has info for the day of week ordered, time of day, and days since the previous order.
- Order Products Prior: Gives information about which products were ordered for a certain order. It also shows the add to cart order, and if the product is a reorder. These orders will be used to create features.
- Order Products Train: Similar to prior orders table except to be used for training.
- Products: Names of products and corresponding product id, aisle id, and department id.
- Aisles: Aisles and aisle id.
- Departments: Departments and department id.
In order to create a model that predicts if a product will be ordered next or not, features need to be created. Intuitively, the best features would be ones that explain human behavior. The best way to do that is first get an idea of the trends of orders.

The daily trends show Saturday (0) and Sunday (1) being the days with the most orders. A majority of the orders are made between the morning and afternoon.
Looking further into the orders throughout the day makes it clear that Saturday and Sunday have the largest order numbers. There are also small spikes in the morning and evening times.
The order trends that customers have seem to be on a week to week basis. There are some clear spikes in orders around every 7 days since their last order. The spike at 30 is most likely due to customers that did not order again.
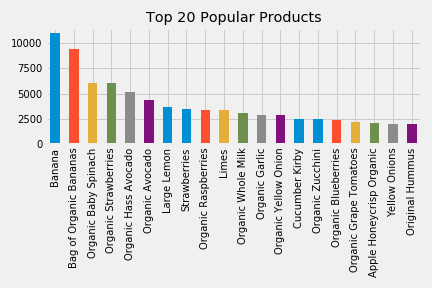
Most of the products that customers order tend to be produce. Apparently Instacart customers love Bananas.

Keep in mind, I used a fraction of the full dataset to perform EDA, the actual dataset was too large to output these plots quickly. The general trend of the data is the same.
Feature Engineering
Initially I kept using the smaller dataset to for features, however when I actually tested the features and started modeling I needed to switch to AWS. My 8 GB Macbook started to have some trouble with the full 3 million orders.
I kept track of my feature progress by creating a baseline and continuously adding and testing features to see what would help the model. The first thing to do was actually create the target. I needed to predict whether or not a product will be ordered in the next cart, so I used the most recent orders to create a new column for each product of whether or not it is in the most recent cart. This 0 or 1 value is what I will try to predict. This also means that the feature table needs to be made up of user-product combinations, not order numbers. I did this with a short script below.
def get_latest_cart(x):
    cart = {'latest_cart': set(product for product in x['product_id'])}
    return pd.Series(cart)

train_carts = (df_order_products_train.groupby('user_id').apply(get_latest_cart)
                                                        .reset_index())
df_X = df_X.merge(train_carts, on='user_id')
df_X['in_cart'] = (df_X.apply(lambda row: row['product_id'] in row['latest_cart'], axis=1).astype(int))
Pandas makes it easy to apply functions to dataframes this way. This is how I created many of my features as well. My first feature was the total times a user has ordered a product. With my base feature, I created a function to manually split the data into testing and training sets. I made a random 20% selection to use as my testing data and made sure those users were not in the training set so there was no overlap or else I would be cheating.
This classification is very imbalanced. Out of five thousand products, only 10 percent of them are actually in someones cart. This is important later on when it comes to optimizing my scoring metric. Which brings me to what my scoring metric actually is. The Kaggle competition requires that F1 is optimized for. This makes sense since you would want to reccomend customers products you know they will be ordering, but also some good choices for things they might not have ordered yet. If I just scored using accuracy, customers would just be recommended things they have ordered, which would most likely be bananas according to this dataset.
The target variable is binary, so to perform quick calculations, I used Logistic Regression to test the features I add to the model. My F1 score for the baseline model was 0.0821… so it took a little while to build it up.
For the rest of the features I created, I split them into categories for User, Product, and User-Product.
| User | Product | User-Product |
|---|---|---|
|
|
|
Modeling
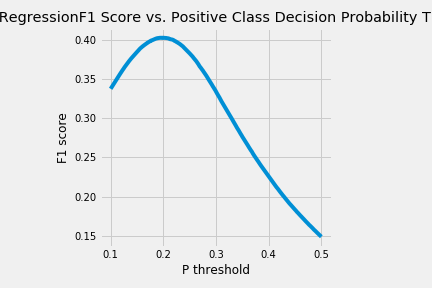
All of these features managed to improve my F1 score up to 0.26. After I got my features, I tested them using a range of different thresholds and weights. The best threshold was able to jump my F1 score to just above .4. Class weights did not help much, only increasing F1 by about .005. The ROC curve and F1 scores for different thresholds can be seen below.


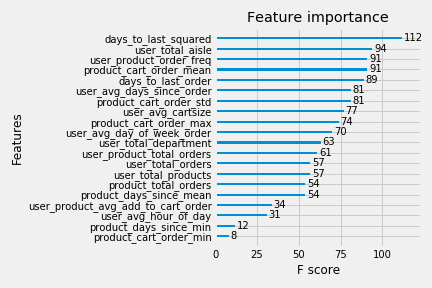
Logistic Regression performed fairly well with the created features. Many of them contributed a decent amount to the model. The feature importances for the top 20 features can be seen below.

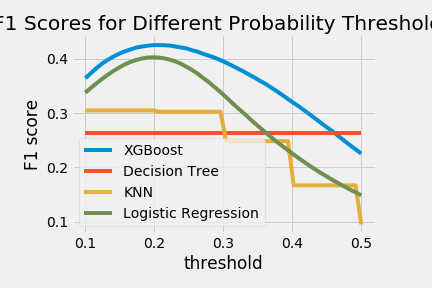
I wanted to test how different classification algorithms performed with these features. So I plotted a couple more alongside the Logistic Regression algorithm on the same threshold range.

Results/Conclusions
Overall, the features I ended up with were pretty decent indicators of whether or not an item will be added to someones cart next. An F1 score of .425 is pretty good for this dataset. For reference, some of the top submissions in the Kaggle competition were not getting past .41, however this competition is also more than a year old. The forums gave some aid of which features were good additions, however actually calculating them was no easy feat.
Gradient Boosting turned out to be the best classification algorithm for this problem. I found it interesting that just by using Decision Tree’s, the model performed the worst. However using XGBoost, which uses the errors from many decision trees, ended up performing the best. My key takeaway from this project would most likely be that the time spent parameter tuning does not give an equal reward. It is definately necessary to use a simple base model and build upon it and save the tuning to get those final last poinst. Overall I am happy with this model that I made and if I were to make any next steps it would be to formally submit the project to Kaggle.
To view my code for this project please refer to my github here.


