Table of Contents
Overview
I wanted my next project to be something that pertains to current events. With all the news about Russia’s focus on United States socail media, I figured that would be a good place to start. I was able to find a dataset released by fivethirtyeight containing 3 million tweets from a company called Internet Research Agency that have since been deleted from Twitter.
The Internet Research Agency (IRA) is a Russian company located in a single building in Saint Petersburg, Russia. An post on The New York Times found here sheds some light on what the company did. Their main business was troll farming. The employees were given a quota of tweets that they were required to produce every day. They managed multiple accounts each of which were directed towards different focuses. Their main goal was to create a toxic environment for information outlets. If people doubt the accuracy of anything on the internet, it would reduce the flow of information.
A count of tweets over time revealed that there are some trends that IRA seems to follow. During specific current events, most in the US and some around the world, they seem to increase their tweet frequency. Below I labeled some points in time that they increased their tweet output.
Despite what some may think, IRA was not just sending tweets trying to push a single agenda. They were more focused on positive and negative comments directed to all political parties. My goal with this project is to see if I can uncover structure within the company and view what their network of accounts looks like.
Data Preparation
Tweets contain many random spelling errors and characters that need to be cleaned to make analysis easier. There are many Russian tweets in this dataset so in order to extract information I needed to keep only the Enlgish tweets. Once I also removed any emoji’s and punctuation, I could start to prepare the data for processing.
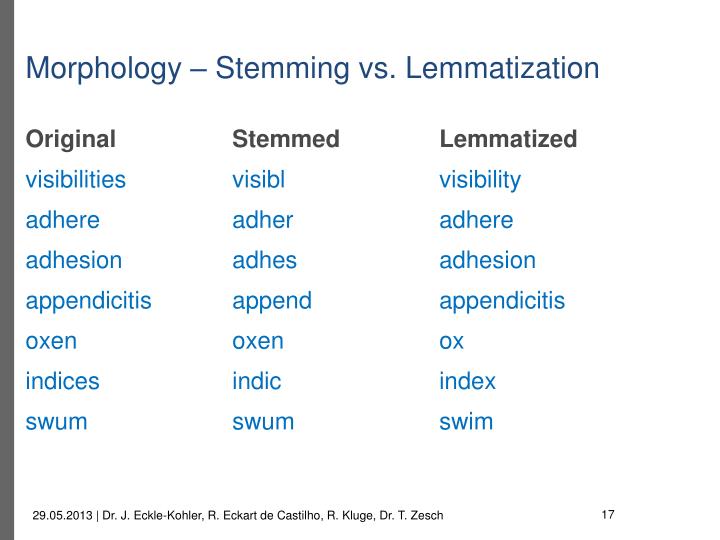
Natural Language Processing works much better with generalized words. A common way to do this would be stemming, although it is also the simplest. The idea behind stemming is to derive the words to a base form. However the process of stemming is simple and only chops off the ending of words to try and achieve this goal. I attempted to use NLTK’s stemmer and once I extracted word topics, they were incoherent. I decided to use another language generalizer called lemmatization. Lemmatization takes part of speech into consideration so words get reverted to a general form while still maintaining their structure. The idea of stemming and lemmatizing can be seen below:

NLTK has a fairly impressive lemmatizer however for the amount of documents (tweets) I am using, it was performing pretty slow. I decided to use a newer framework called SpaCy that lemmatizes in a different way. NLTK attempts to split the text into sentences, SpaCy constructs a syntactic tree for each sentence which allows for much more information about the words to be retained. An example of this tree can be seen here. This made it very easy to remove things like pronouns.
The final step before converting to a term-frequency format for NLP is creating N-grams. I decided to only use bi-grams since tweets are generally short sentences and anything higher may not result in being useful. Bi-grams double up words so something like “new york” is captured instead of just reading “new” and “york”.
Topic Modeling
To extract topics from the tweet data, I needed to choose a factorization method. PCA gives negative factors a well as positive which is difficult to interpret for tweet topics that may contain a large amount of different components. Since tweets contain tons of different words, probabilities from LDA did not give me any more indication of topics and made determining them more confusing. I decided to use Non-Negative Matrix Factorization to extract topics.
Sklearn makes using a complex factorization tool like NMF fairly easy. The first thing I did was create a term document matrix. This means that each document (tweet) is a row and each column is a unique word (token). These tokens are given frequency counts for each document by just using the snippet of code below.
vectorizer = CountVectorizer(analyzer='word', max_features=100000, stop_words=stop_words)
tweet_counts = vectorizer.fit_transform(string_tweets)
With millions of tweets, there could potentially also be millions of words. I decided to limit the words to 100,000 and initially started with the standard stop words that NLTK has. The next step is to apply weights to the counts to account for occurences across all documents and the local document. This will be the Term-Frequency Inverse Document Frequency matrix (TFIDF).
- TF: Weight directly proportional to count for term within the document (local count).
- IDF: Weight inversely proportional to count for term across all documents (global count).
SKlearn also makes this simple with the following code snippet.
transformer = TfidfTransformer(smooth_idf=False);
tweet_tfidf = transformer.fit_transform(tweet_counts)
Once the TFIDF matrix was created, I fit the NMF model to the data and extracted the top 20 words of three topics to start.
| Topic# 01 | Topic # 02 | Topic # 03 | |
| 0 | workout | exercise | trump |
| 1 | gym | eat | president |
| 2 | partner | right | donald |
| 3 | kill | diet | news |
| 4 | sleep | walk | politic |
| 5 | leg | run | break |
| 6 | eat | people | obama |
| 7 | sore | ball | people |
| 8 | ass | lose_weight | vote |
| 9 | clothe | fat | hillary |
| 10 | run | life | clinton |
| 11 | shower | body | man |
| 12 | right | sleep | win |
| 13 | plan | fun | supporter |
| 14 | wake | extra_fry | black |
| 15 | tired | food | right |
| 16 | life | tired | white |
| 17 | finish | healthy | woman |
| 18 | girl | man | police |
| 19 | music | lazy | kill |
In an effort to extract the topics that I thought would point to different political or world news subjects, I actually ended up extracting the tweets that the fake users would post to appear like real people. It looks like the go-to subject for appearing like a real account is excercise. I attempted to add gym lingo to my stop words to try and get rid of these gym topics but a better use was just filter out any tweets that were related to the first two topics. I treated these as fakes of the fake accounts as they did not tell me anything about the focus of IRA.
Once I filtered out the gym topics, I split the remaining data into 5 topics. This gave what I thought to be the clearest separation of topics, however they are still somewhat mixed together.
| Topic # 01 | Topic # 02 | Topic # 03 | Topic # 04 | Topic # 05 | |
| 0 | news | trump | blacklivesmatter | man | people |
| 1 | state | president | black | local | black |
| 2 | topnews | donald | blacktwitter | police | white |
| 3 | topnew | politic | blm | sports | right |
| 4 | fake | break | staywoke | woman god | |
| 5 | kill | obama | blackskinisnotacrime | shoot | obama |
| 6 | syria | hillary | racism | kill | music |
| 7 | attack | clinton | policebrutality | sport | life |
| 8 | local | maga | cop | politics | vote |
| 9 | china | vote | support | arrest | american |
| 10 | report | supporter | blacktolive | black | hillary |
Visualization
I decided to keep these topics general to begin with. I gave them labels best describing the political focus based on the top words. A topic for general news posts, right wing focused tweets, and left wing focused tweets.:
- Topic #01: News
- Topic #02: Right
- Topic #03: Hashtagging
- Topic #04: News
- Topic #05: Left
I then used NLTK’s vader sentiment analysis to further specify the topic names. By determining if the tweet was positive or negative, I filtered the tweets into more specific topics. If a tweet was focused on a right wing topic but was negative, I could label that as a left wing tweet and vice versa. The hashtagging topic was generally left wing hashtags focusing on things like the black lives matter movement. If a hashtag tweet was negative I labeled it as toxic and if it was positive I included it with left wing tweets.
I gave the negative right or left tweets labels of toxic as well. However the toxic left wing did not have a large quantity to show any separation so I included them all with left wing tweets. Overall I ended up with the following topics which I color coded for some plots below.

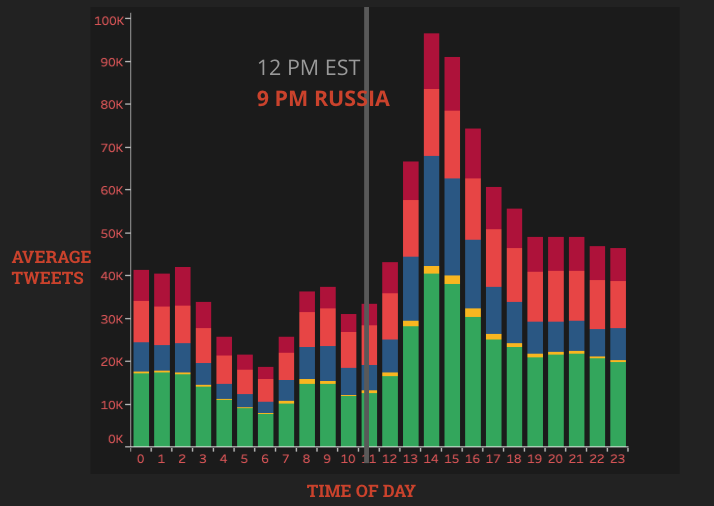
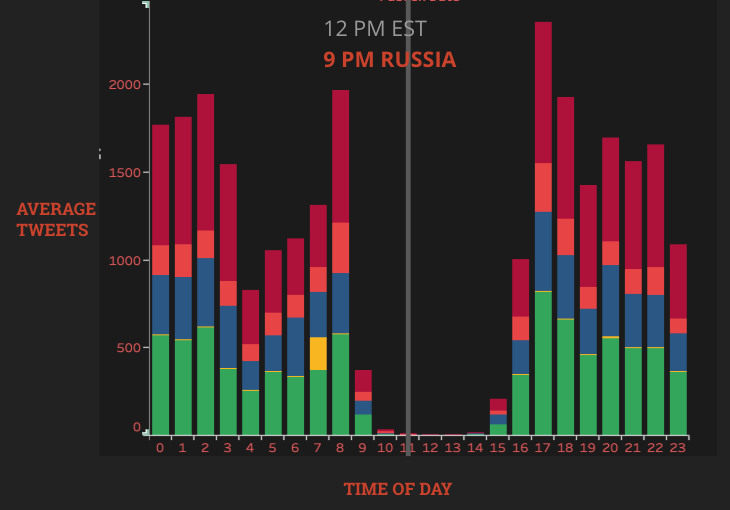
The plots below show the levels of activity of IRA during different times of the day.


It is important to note that during midday in the United States, there was still a considerable amount of tweets even though in Russia it would be off-work hours. The main difference between these timeframes is that the left plot is when Donald Trump was running for his presidency. The plot on the right is after he became president. There may be other factors in IRA’s shift of work times, however it is clear that there was a large change in focus during this time.
The overall averages throughout the day also decreased. While the right plots timeframe is less that the lefts, there is still a considerably larger amount of tweet output during Trumps candidacy.
Using sentiment for tweets is difficult since it is really only keeping count of positive or negative words. Taking an average and looking at the changes over time is a good way to get a general sense of sentiment.

The user CRYSTAL1JOHNSON became a very highly followed left wing focused user over the years. Tracking the sentiment of this users tweets shows that before Donald Trump was elected, the tweets were overall more negative. Then after the election, they became more positive. It is difficult to conclude why this was for sure, but intuitively I would say the fake account was trying to coax its Democratic followers into supporting Trump.
With the topics established and users labeled, I could create an example network using retweets and mentions from IRA’s tweets. Every node would be a user colored according to their topic. The toxic users did not transfer well to the network graph so I decided to keep just three user topics: Right, Left, and News.
The size of the node would correspond to the amount of followers that the account has. The edges between each node were made if one account was either retweeted or mentioned. Note that this network only contains accounts that had a connection with another. Many of the fake accounts operated alone that did not contribute anything to the network.

There is a clear split of groups between Democratic and Republican topics with some overlap of smaller accounts. Generally, the connections seem to pool around larger accounts, most likely trying to spread their tweets using the large following that the accounts have.
There are distinct groups between the Repulican and Democrat users, however not so much for the News users. News users tend to be spread out between the two groups. Intuitively, I would say this is because the tweets they put out were just news stories, not leaning to one side or another. Then the other fake users would work off of this by retweeting or mentioning the news stories and their opinions of them. This makes sense for some of the accounts as they have many connections between the Republican and Democrat users. This gives some insight into the structure of the company and how they fueled themselves off of these news accounts as well as the more popular fake users.
Limitations
NMF proved to be a useful algorithm to uncover structure behind this Russian troll company. However, it is still difficult to uncover smaller details in the tweets. Factorization methods like NMF and LDA, while being useful are still just fancy ways to count words. Meaning behind the sentences are lost and while sentiment analysis can uncover some more details about the text, it is still not totally accurate. Tweets can have so many different focuses within them that it is difficult to go deeper than just general topics like Republican or Democrat. A more robust solution may be to use neural networks that can understand not only a count of words in each tweet but how they are organized as well. The next NLP project I pursue will most likely make use of some type of neural network.
You can find my notebooks on my github here.

