Table of Contents
Overview
Data Science has become a popular subject in recent years. The title of Data Scientist has been adopted from many companies, however the actual skills needed seem to vary job to job. With my past couple months focused on data, I thought it would be appropriate to gather as much data on data related positions as I could. The information I gather will hopfully tell me what skills are the most important to Data Scientists and what the salary should be for certain sets of skills.
Data Acquisition
Glassdoor has been my main site of choice for job searches, so I figured I would start there. In order to get the best overall idea of skills, I needed to gather a lot of data. I attempted to use the Selenium/Beautiful Soup route initially to scrape the data, but Glassdoor is not fond of you scraping their web pages. Selenium is also somewhat slow for what I needed.
I decided to utilize a very useful web scraping framework called Scrapy. The public github for any Scrapy information can be found here. It is a very useful tool and I recommend looking into it if you need to get large amounts of data from webpages.
Scrapy has a very convenient setting that will cycle IP addresses and delay downloads to get past any IP blockers that are set in place. I set up a quick script to scrape the newest bunch of proxies from a free proxy site, so I wouldn’t have to keep going back more than once.
def get_proxies():
    url = 'https://free-proxy-list.net/'
    page = requests.get(url)
    parser = fromstring(page.text)
    proxies = set()
    for i in parser.xpath('//tbody/tr')[:50]:
        if i.xpath('.//td[7][contains(text(),"yes")]'):
            #Grabbing IP and corresponding PORT
            proxy = ":".join(['http', '//'+i.xpath('.//td[1]/text()')[0], i.xpath('.//td[2]/text()')[0]])
            proxies.add(proxy)
    return proxies
Another useful feature is the multiple download starts. I quickly found out that glassdoor only shows the first thousand job postings, after that the pages will 404. A thousand job posts is decent, but many of those may not even be related to data positions. Instead of setting the scraper to search the whole country for Data posisions, I gave it six different state searches: NYC, California, Seattle, Colorado, Texas, and Virginia. Scrapy would simultaneously go through each of these pages, so in the end I had around 6,000 job postings to work with.
Feature Engineering
The heart of this project relied on the feature engineering to find some type of relationship between job skills and salary. This was going to be a supervised regression problem, so I needed to use Glassdoor’s salary estimations as my dependent variable. I filtered out any postings without salary estimations and cleaned any punctuation out of the job descriptions to make feature extraction easier.
Since I am dealing entirely with text data, I need to create dummy variables for all of my features. This is essentially vectorizing my job descriptions into a sparse matrix, except I am choosing the features myself. This is a very manual process with a lot of retracing steps to see what features work and what doesn’t. Ultimately, I split my features into six different categories.
| Programming | Skillset | Company Specific | Degree | Experience | Tile |
|---|---|---|---|---|---|
|
|
|
|
|
|
In order to prevent overfitting, I needed to split up the data that I scraped into testing and validation sets. Since I needed to also test to see if the features I created made an impact on the model, I kept a holdout set to run the final model on. I used a 70/30 split for the holdout set then another 70/30 split for the training and validation set. The split would look something like below:
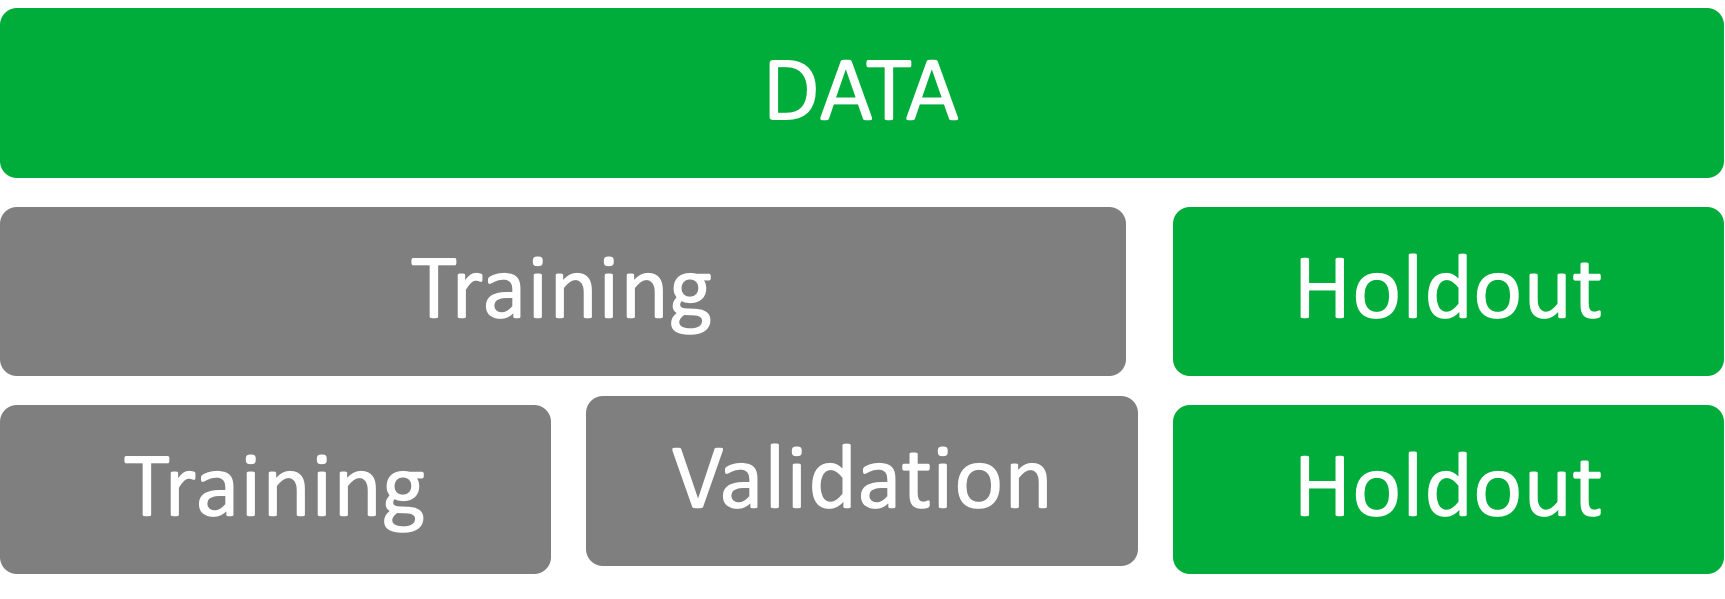
I wanted to see how much of the variance in the dependent variable I could explain from the independent variables that I create. So using R-Squared as my metric, I progressively added more and more features to see what would improve the model. After trial and error, I ended up with four feature categories from above: Degree, Language, Skill, and Title.
Modeling
Using the features I created, I linearly fit a model and viewed how each coefficient correlated with the salary of data science positions. The model does show correlation that intuitively makes sense based on the coefficients. Looking at the visual representation below:
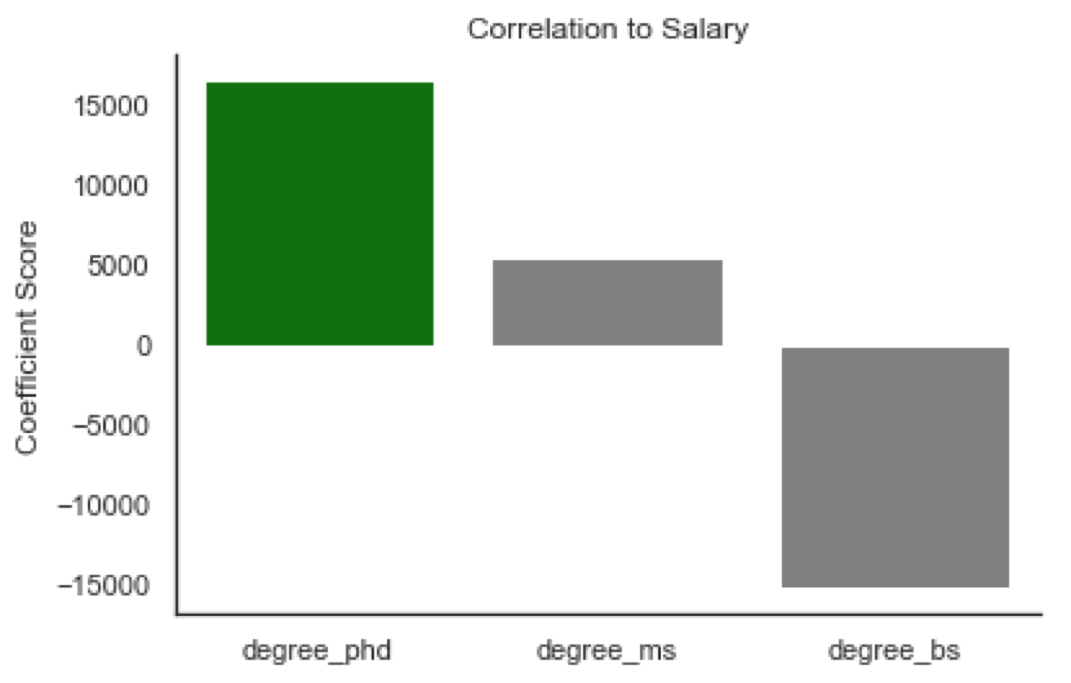
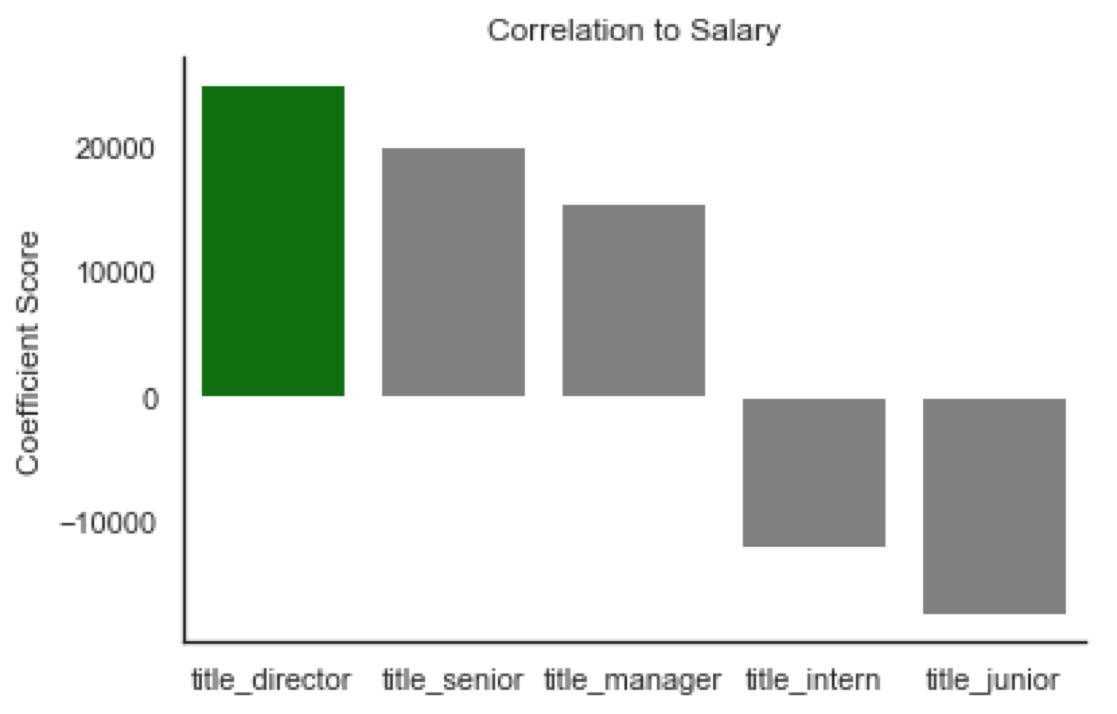
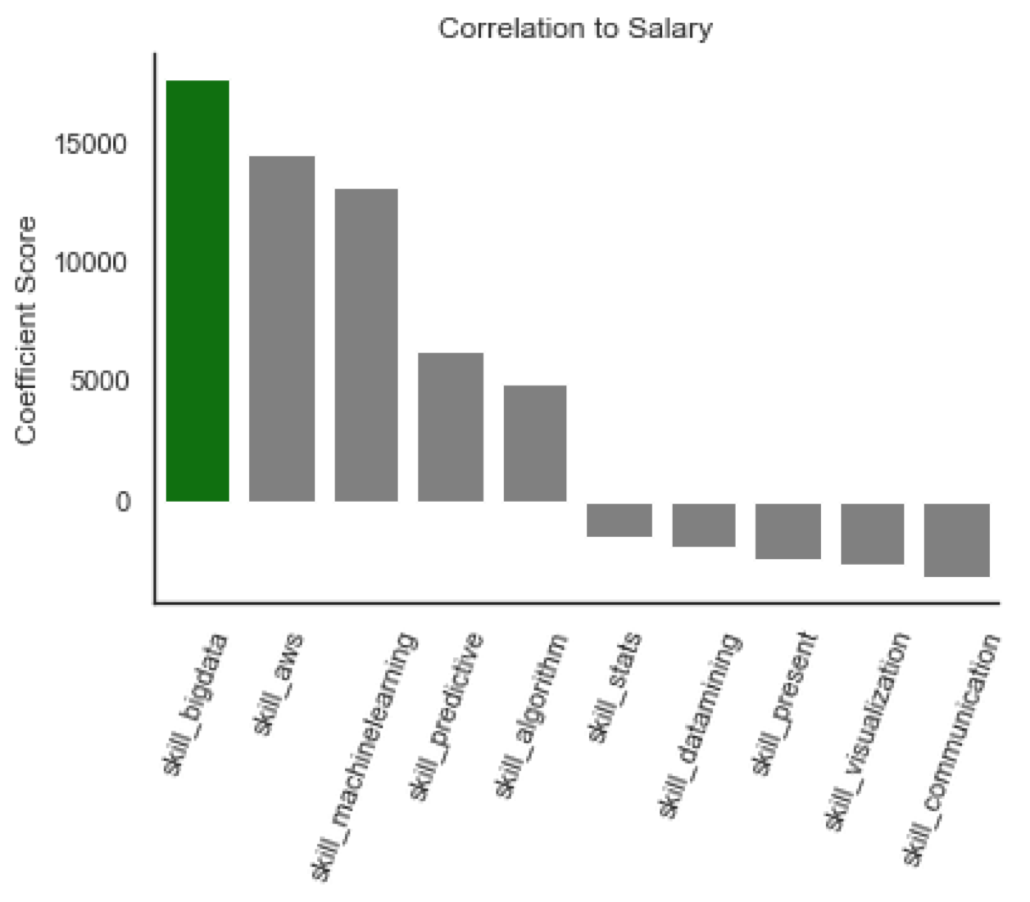
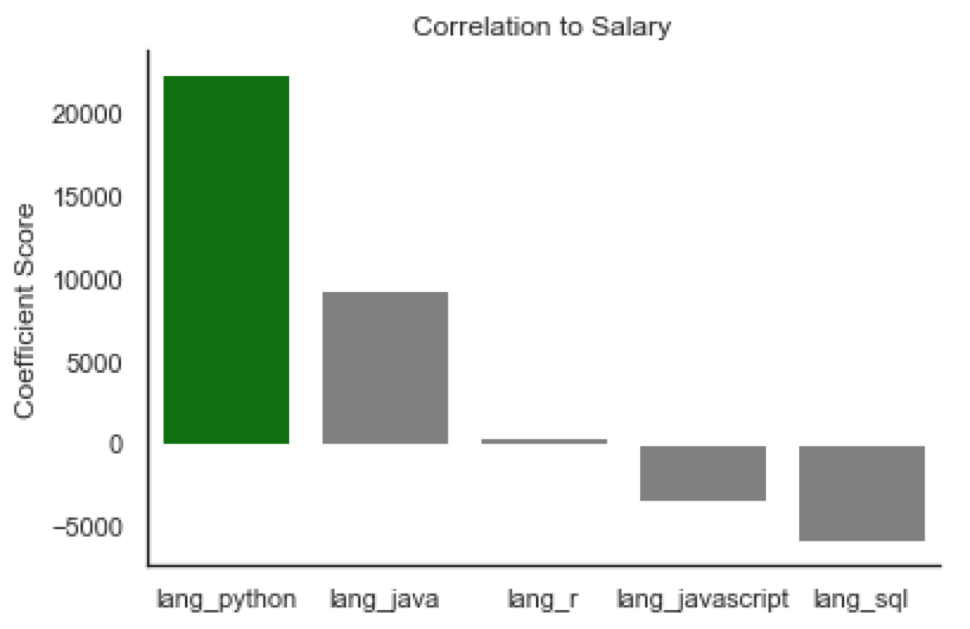
Looking at these relationships side by side, it is clear that some make sense intuitively while others seem slightly off. The title coefficients have a leader with the title of director. However, the language python looks to be just as important related to salary as the title of director. It is imprtant to keep in mind that these coefficients are based on occurences withing the job descriptions. Many of the highest paying jobs will have python listed as a skill, and the few highest paying jobs would have a title of director which could be why they have an almost equal score.
Another interesting takeaway is that skills like communication and presenting look to be associated with less high paying jobs. Bachelors degrees also appear to be less correlated with salary. These would seem incorrect since every job appears to require a bachelors degree. Although that is most likely the reason that they have a negative correlation with salary. Since every single job post has these skills listed, they carry no weight to contribute value to the model.
In addition to skills that are constantly spammed into job descriptions, I tried including work experience for low (0-3 years) and high (3+) years. It actually negatively effected the model which is why I did not even include it in the model. The fact that work experience doesn’t contribute value to my model is somewhat relieving. This means the advice to take required experience on job postings with a grain of salt may actually be true.
Results/Conclusions
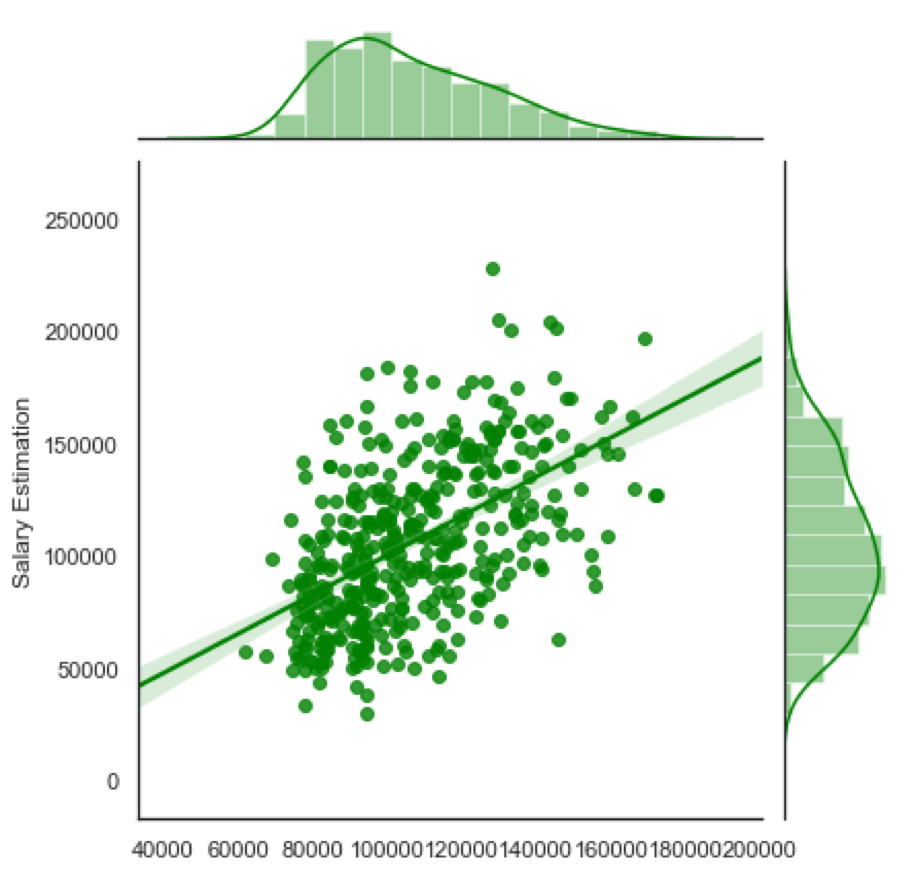
The features I created are very close to capturing enough of a trend to make a salary predictor. However, the model still is not perfect. My root mean squared error ended up being around $30,000 and my R-Squared value was .31 when tested on the holdout set. There is definately some trend that my features are not capturing. This is clearly shown from the plots below:
| Acutal vs Predicted | Residuals vs Acutal |
|---|---|
 |
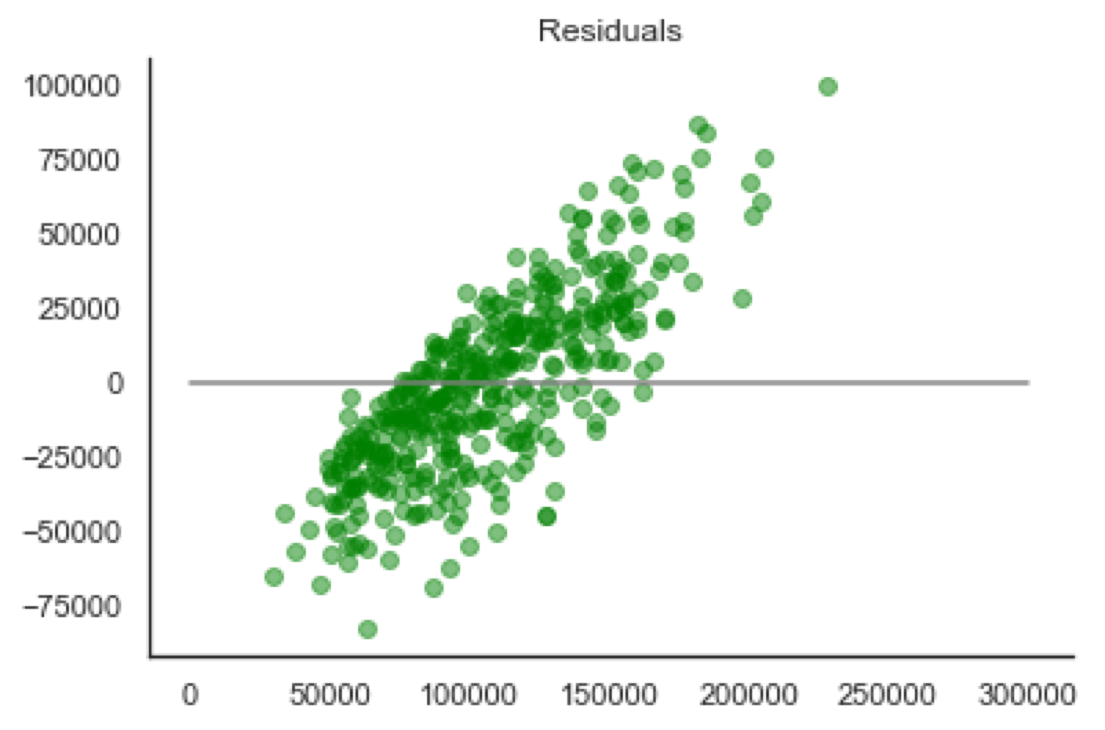 |
The residuals plot is showing the error between my predicted values and the actual salaries for the job postings. There is a clear linear trend in the residuals which means there is a polynomial relationship that my current features are not capturing. Once I had this model, I attempted to use L1 and L2 regularization to attempt to generalize the model, but the model actually performed worse. In order for the model to be able to predict salary from given skills, more features will need to be created to improve the R-Squared value.
Limitations/Future Work
This model contains some limitations that could be accounted for if I have time to come back to this project. The main limitation is that the features are all one hot encoded variables which makes it difficult to transform any of the features. If I could calculate some totals between the job descriptions, that may help improve the model.
My features are currently made out of words I extract manually. It may be more useful to use NLP strategies and lemmatize the job postings to extract topics using something like non negative matrix factorization (NMF). If these strategies brought the accuracy of the model up, future work would include applying the model to a web app that will predict your salary based on skills you have.
The jupyter notebook and scraping scripts I wrote can be found here
